Lab 6: Amazon Quicksight
Business intelligence with Amazon Quicksight
Let’s now have a look into a cloud-based BI tool, Amazon Quicksight.
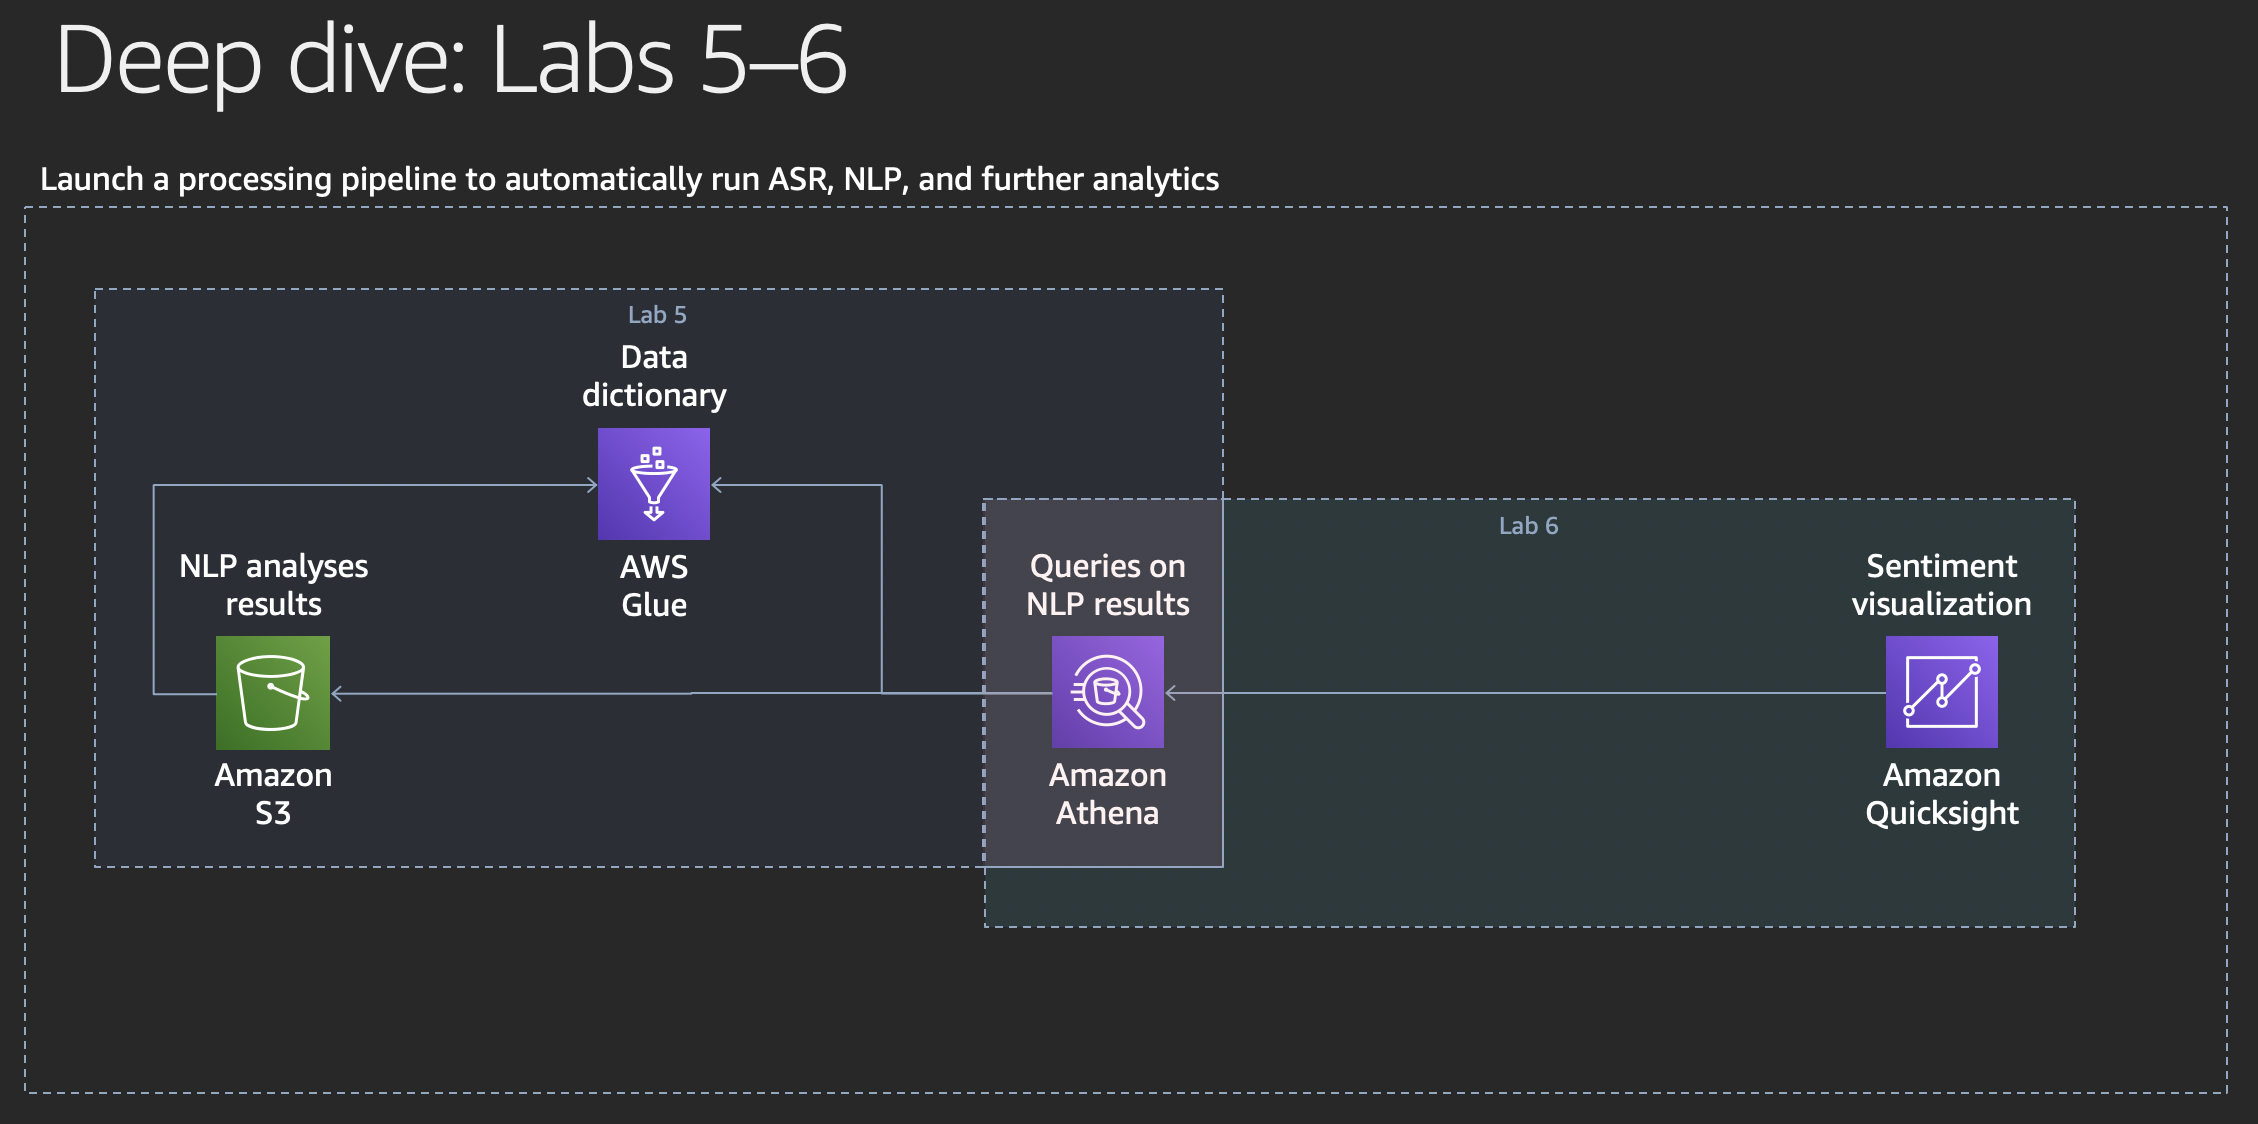
Amazon QuickSight is a fast, cloud-powered business intelligence (BI) service that makes it easy for you to deliver insights to everyone in your organization.
QuickSight lets you create and publish interactive dashboards that can be accessed from browsers or mobile devices. You can embed dashboards into your applications, providing your customers with powerful self-service analytics. QuickSight easily scales to tens of thousands of users without any software to install, servers to deploy, or infrastructure to manage.
With the industry’s first pay-per-session billing model, you only pay for what you use. This allows you to give all of your users access to the data they need without expensive per-seat licenses.
Account preparation
In this section we prepare your AWS account for using Amazon Quicksight.
When you go to the Amazon Quicksight console, it tells you that your AWS account is not signed up to Amazon Quicksight. Click the
Sign up for Quicksightbutton.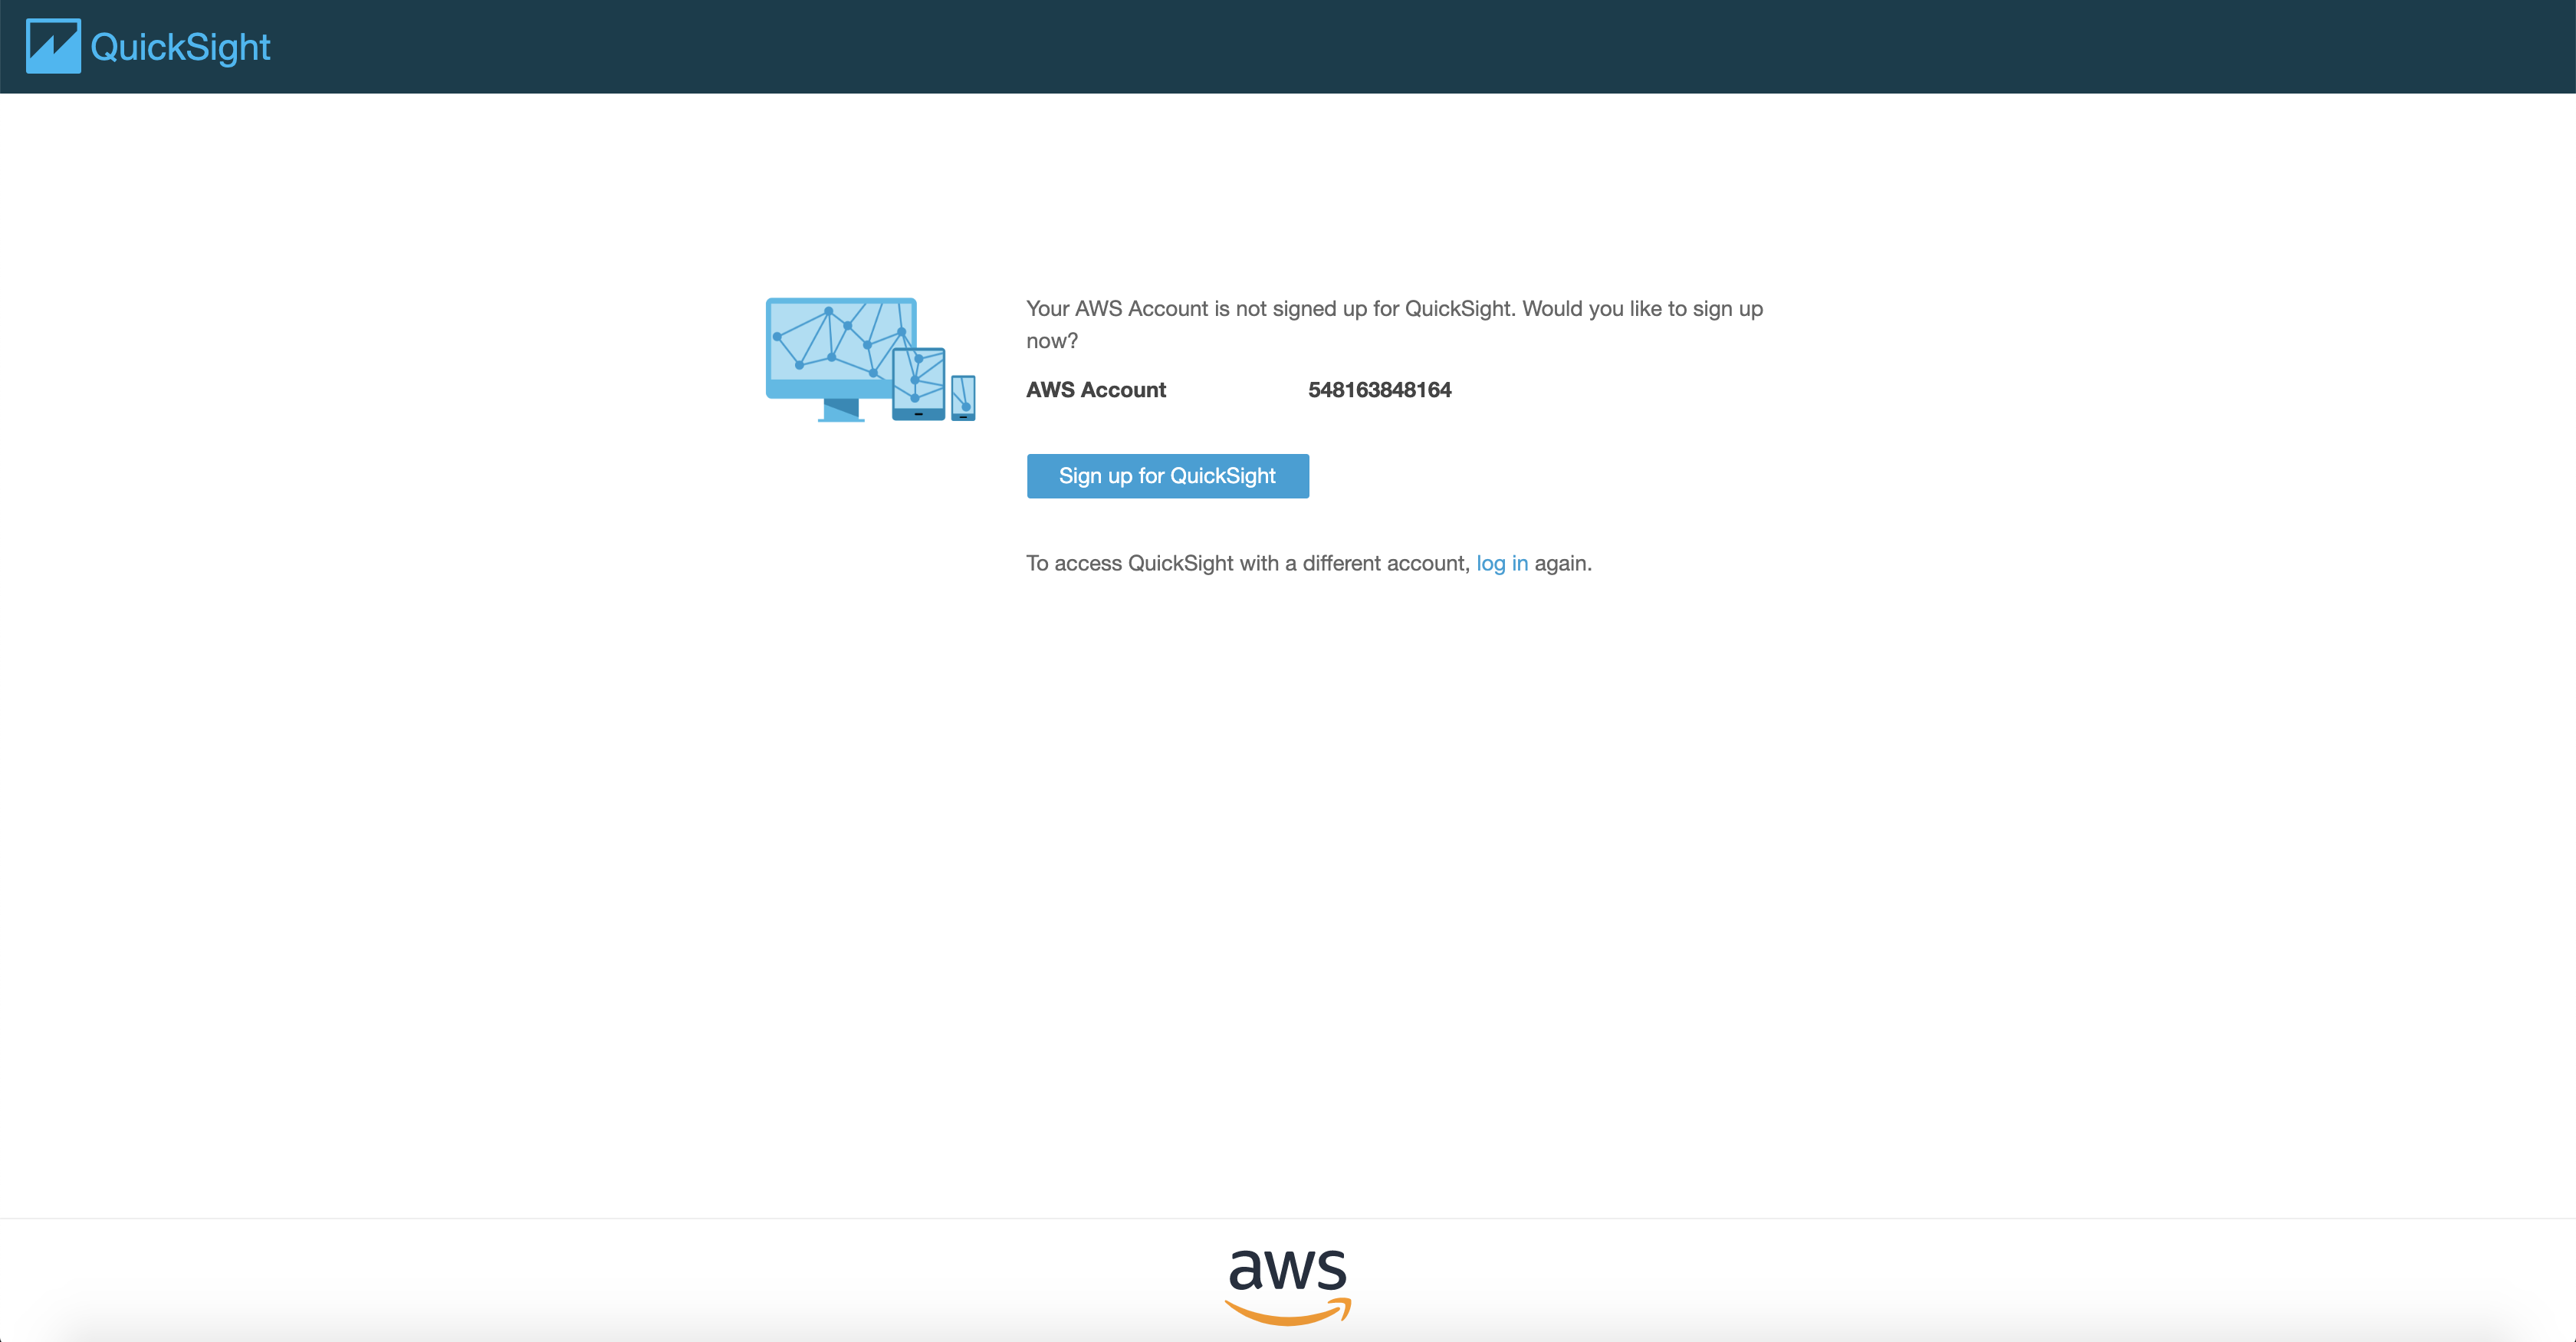
On the next screen, select
Standardconfiguration. Scroll down to the bottom of the page and click theContinuebutton.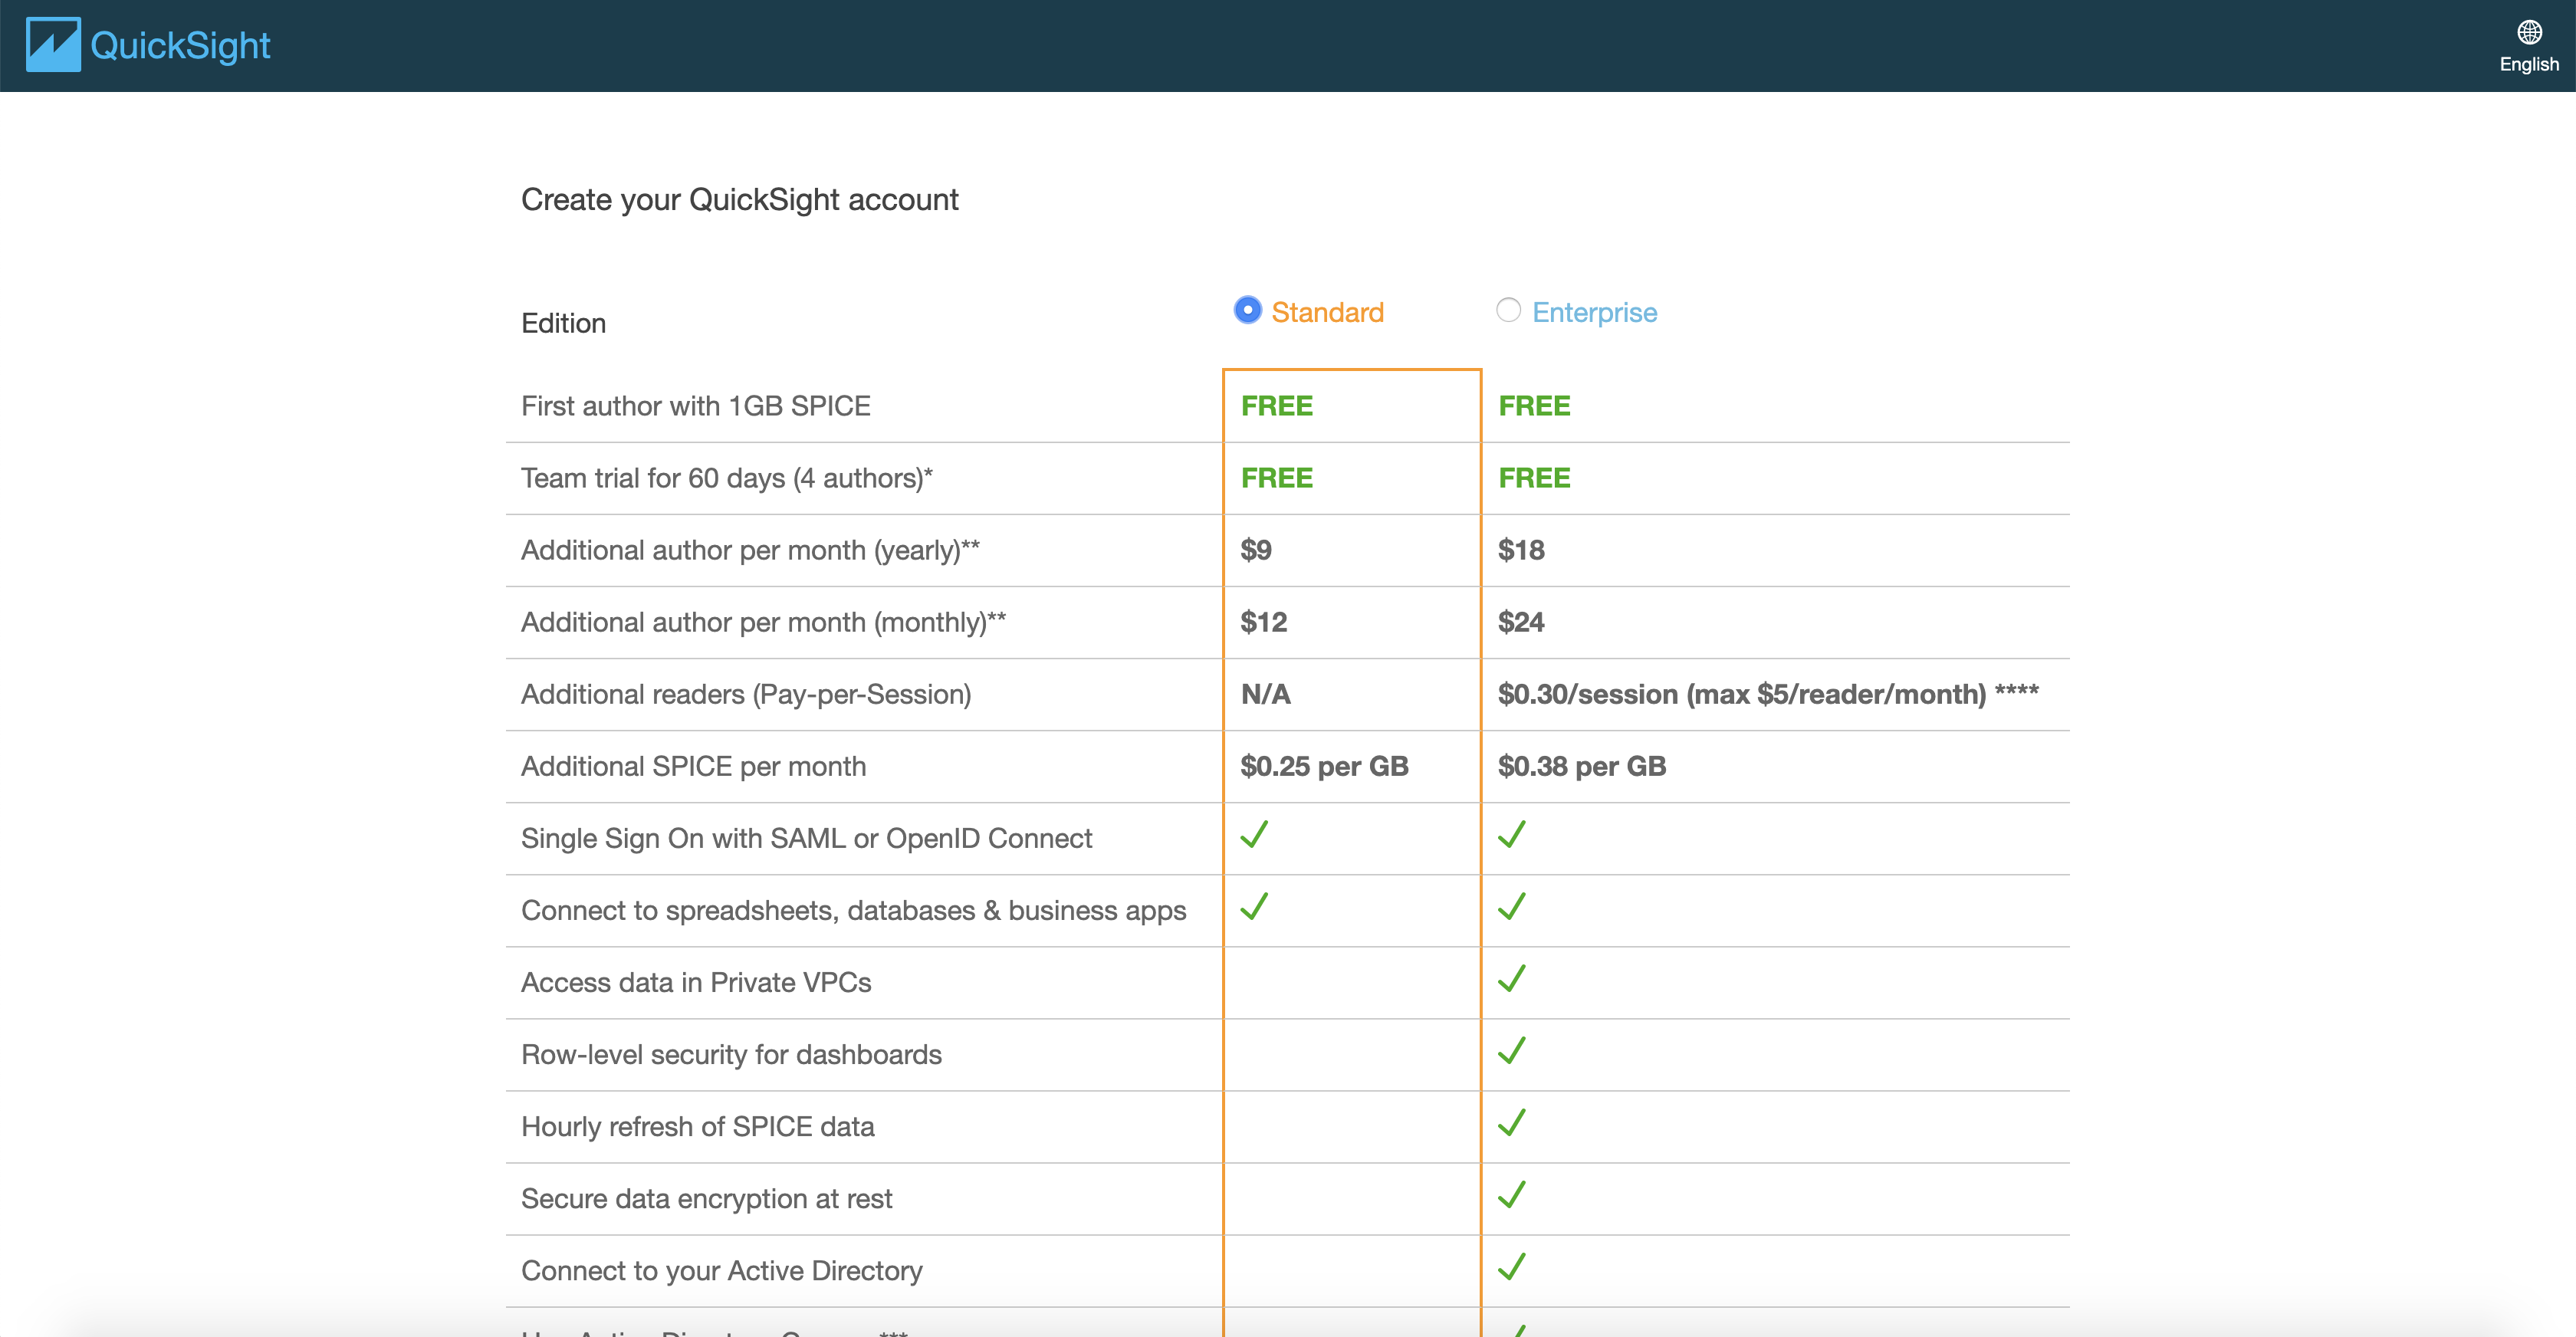
On the next screen, ignore the warning
This IAM user or role may not have all the correct permissions to subscribe to QuickSight...if you see it in a red box at the top of the screen. Scroll down and make sure that there is a tick in the check box next toAmazon Athena. Then click directly below onAmazon S3orChoose S3 bucketsand select the name of your processing bucket that holds all data about your call recordings.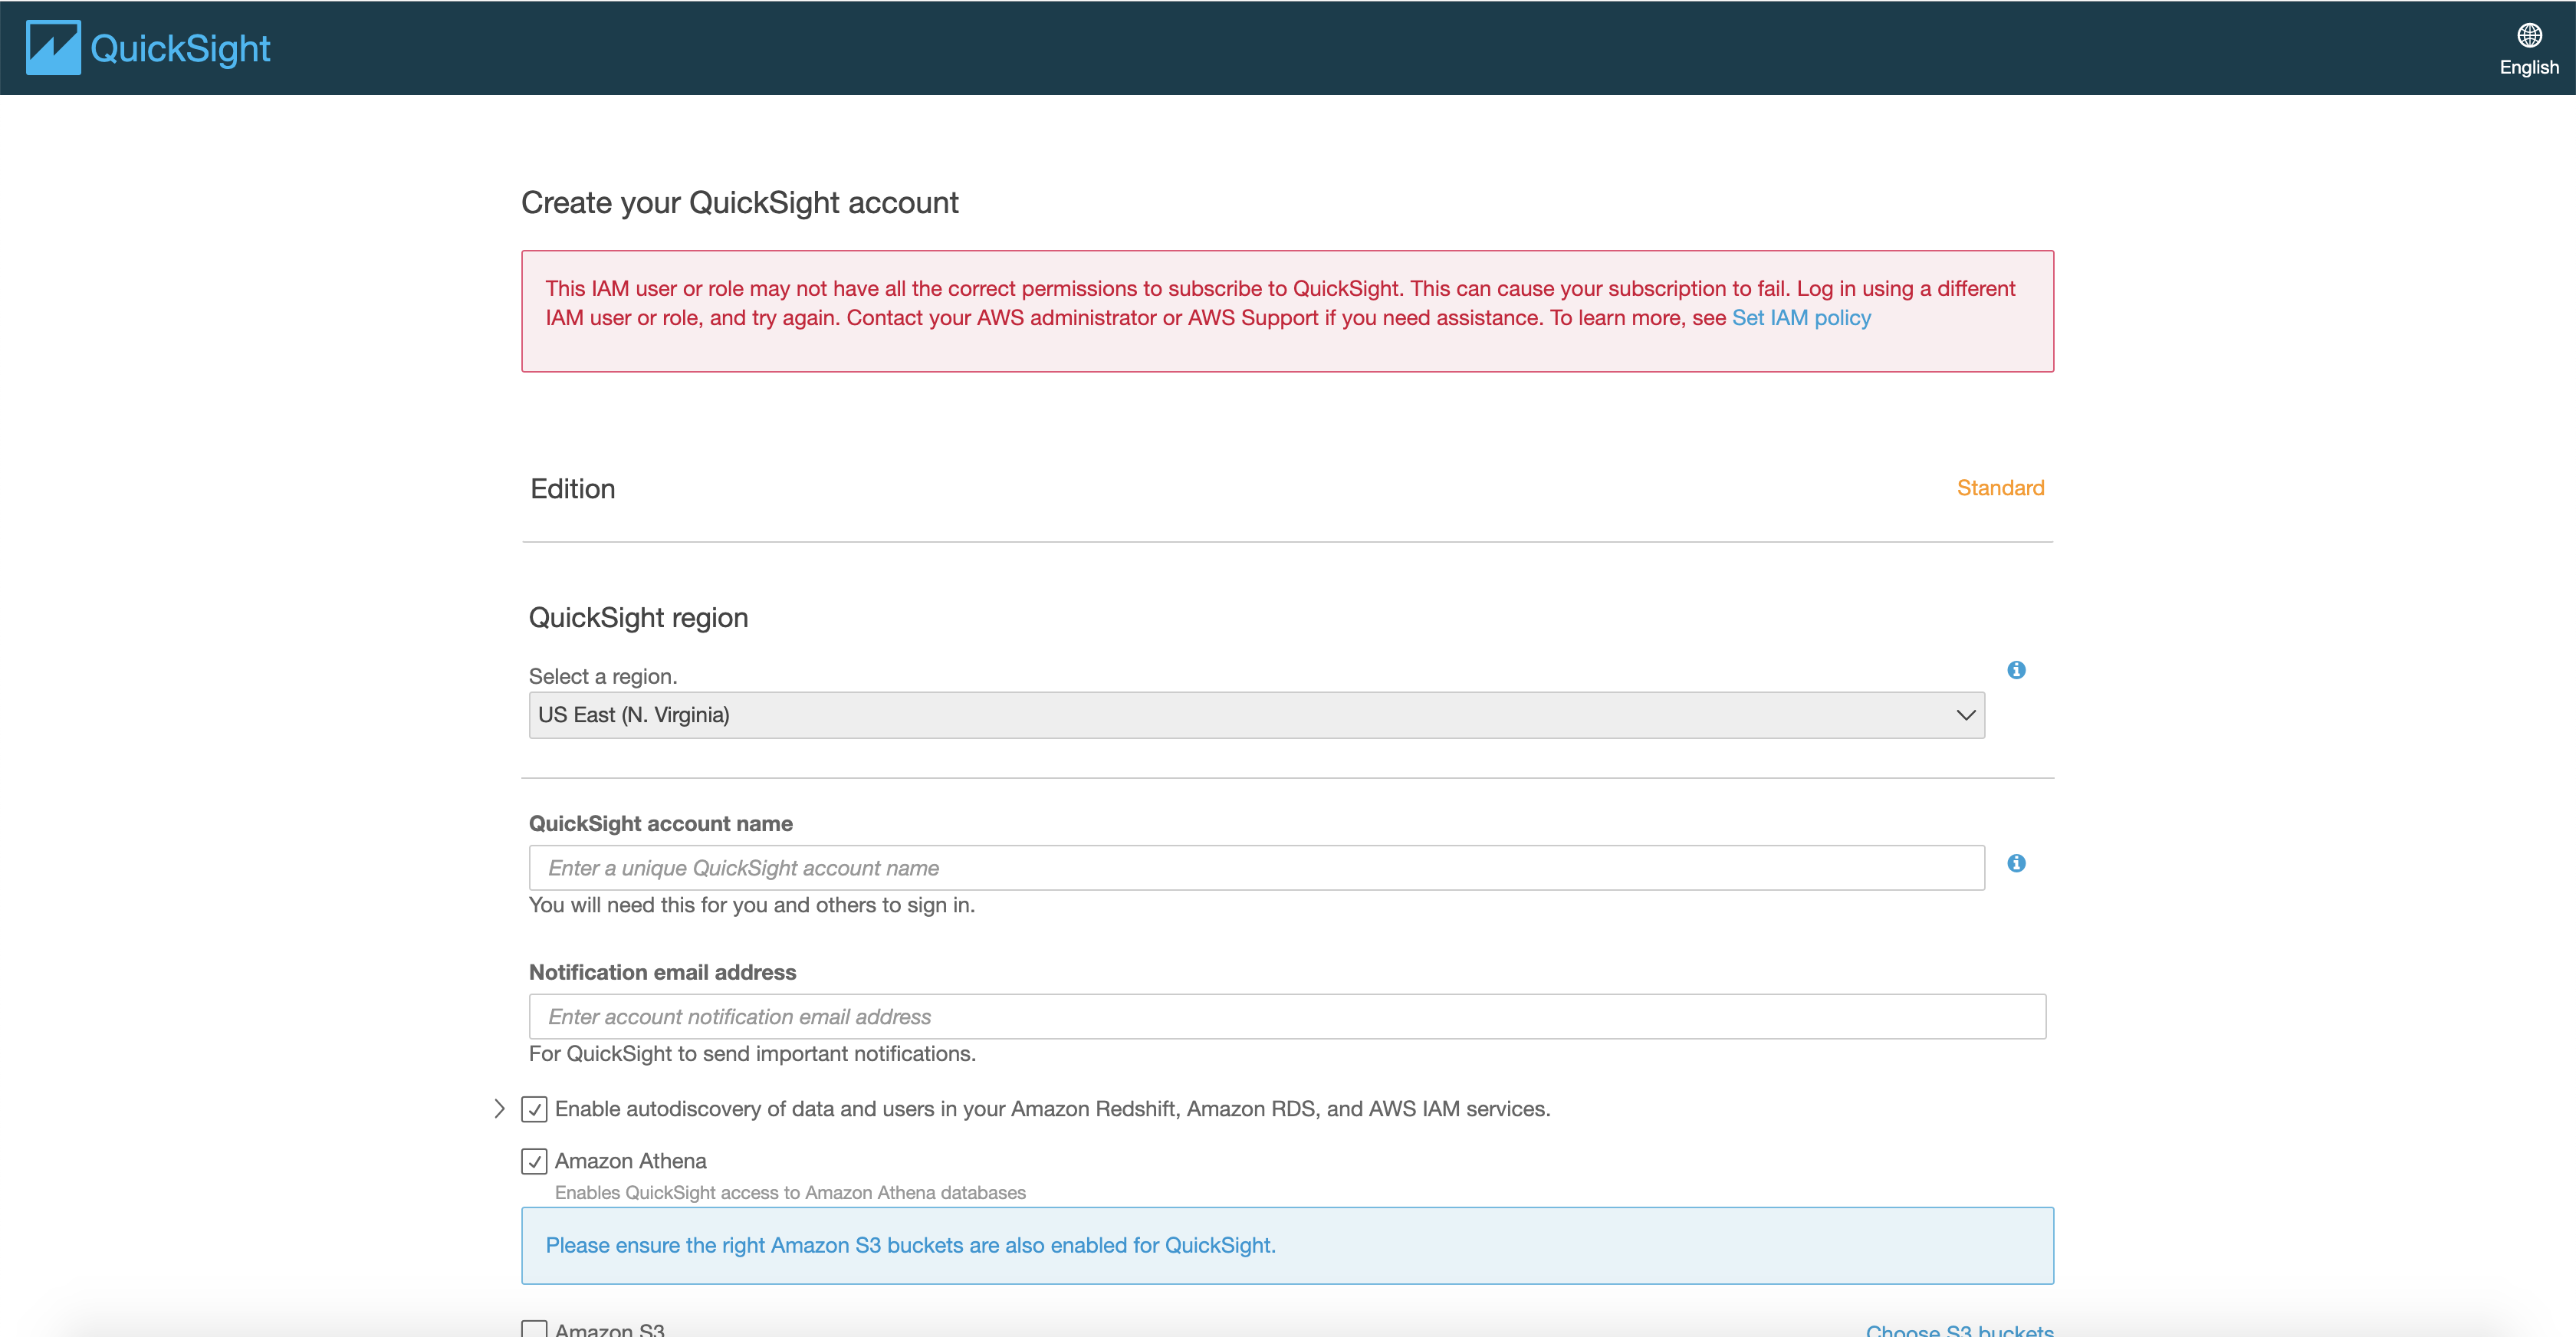
Also enter a unique value in
QuickSight account nameand a valid email address inNotification email addressand click on theFinishbutton. Your Amazon Quicksight account is being created.After a few moments, you’re all set to use Amazon Quicksight. You should see a message similar to
Congratulations! You are signed up for Amazon QuickSight!and a buttonGo to Amazon Quicksight. Click on that button to continue.
Visualize processing results
Now you’re back to the Amazon Quicksight console. In case you see a
What's New in Amazon Quicksightpop-up, click on theClosebutton to continue. Make sure the right region (Northern Virginia) is still selected in the upper right corner. Click theNew analysisbutton in the top left corner.On the next screen, click the
New data setbutton.On the next screen you select your data source. In our case, we want to visualize data from an Amazon Athena table. Hence we click the
Athenatile.We’are asked to provide a name to our data source. Please use
connect-comprehend.Then click the
Validate connectionbutton to double check that Amazon Quicksight is entitled to interact with Amazon Athena on your behalf. Click theCreate data sourcebutton to continue.We need to select the database from Amazon Athena (effectively, it’s provided by AWS Glue) that contains our sentiment analysis table. You can open the Amazon Athena console (or the AWS Glue console) in another tab to have the names at hand. Once you have selected the right database (starting with
comprehendgluedatabase), you will see the table namedsentiment_analysisthat you know already from your previous experiments with Amazon Athena.Click the
Use custom SQLbutton to continue, not theSelectbutton.Now you can enter your custom SQL query. This is required because, as you have seen before when you ran the queries in Amazon Athena, some values in the virtual table contain nested arrays. The custom SQL query we’re going to use now will unnest these values.
Use an arbitrary name for your query, e.g.
sentiment-query, in the text field pre-filled withNew custom SQL. Then use the following query for theEnter SQL here...text area and replace<YOUR DATABASE NAME>with your virtual database that contains yoursentiment_analysistable.WITH sentiment AS ( SELECT contactid, talker, text, sentiment FROM "<YOUR DATABASE NAME>"."sentiment_analysis" ) SELECT contactid, talker, transcript, sentimentresult.sentiment, sentimentresult.sentimentscore.positive, sentimentresult.sentimentscore.negative, sentimentresult.sentimentscore.mixed FROM sentiment CROSS JOIN UNNEST(text) as t(transcript) CROSS JOIN UNNEST(sentiment) as t(sentimentresult)Click the
Confirm querybutton to continue.In the
Finish data set creationdialog, leave everything untouched and click theVisualizebutton.On the screen you land now, please observe the box in the top right corner. When it says
Import completeyou can start constructing your visualizations. Let’s make use of theAutoGraphtile first, before you can later explore the other options.Select the
sentimentand thetalkerfields and see how they are visualized in theAutoGraphtile.Open the drop down list in the upper right corner of the
AutoGraphtile and click theMaximizeoption. If you couldn’t see the color codes for the diagram before, you can now. How does your visualization look like?You can now play with the various diagram types and explore Amazon Quicksight as you like. Discuss within your team what makes sense to your business.
Conclusion
Congratulations!
You have successfully used Amazon Quicksight to visualize your processing data.